
The structures of the ocean floor play a role in determining how water masses and ocean currents travel and influence our climate. Seafloor landforms have an impact on biodiversity.
As a result, obtaining as much detailed information on the topography of the seafloor as possible is critical for oceanographic and climate studies.
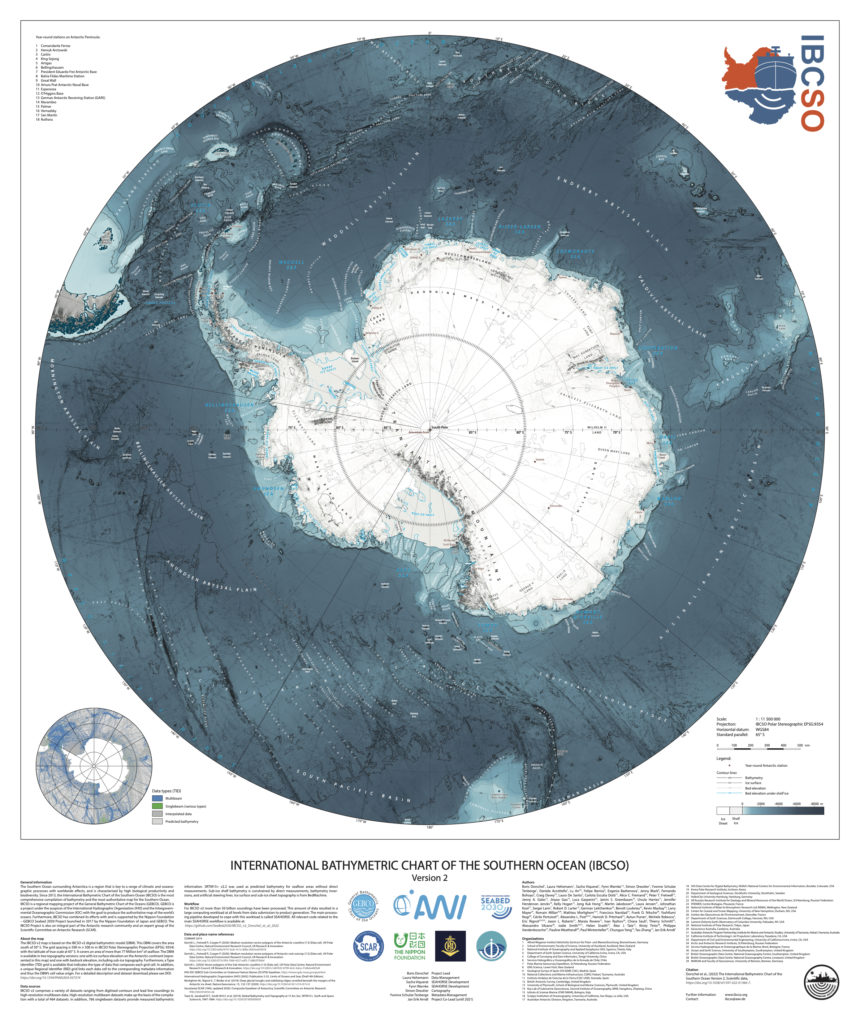
The Alfred Wegener Institute led a team of worldwide researchers to produce the second version of the International Bathymetric Chart of the Southern Ocean (IBCSO v2), the best and most detailed seabed map ever of this critical part of the Earth’s system.
The map, as well as the complicated processes needed to build it, was published in the journal Scientific Data by Nature.
The Southern Ocean, which encircles the Antarctic continent, is an important part of the Earth’s system and climate.
The Antarctic Circumpolar Current, which is influenced by ocean currents in the Pacific, Atlantic, and Indian Oceans and is propelled by high westerly winds — the famed “Roaring Forties” – is a vital connecting factor in the globe-spanning thermohaline circulation.
Furthermore, the cold water of the Southern Ocean absorbs a large amount of CO2 and heat from the atmosphere, acting as a temporary buffer against many of the detrimental effects of anthropogenic climate change. Furthermore, these waters have high biological productivity and are home to a diverse range of species.
Despite its importance, only a few sections of the seafloor have been explored and documented in detail in the Southern Ocean, as in many other oceans. Despite the fact that satellite data covers the whole ocean, it has a low resolution.
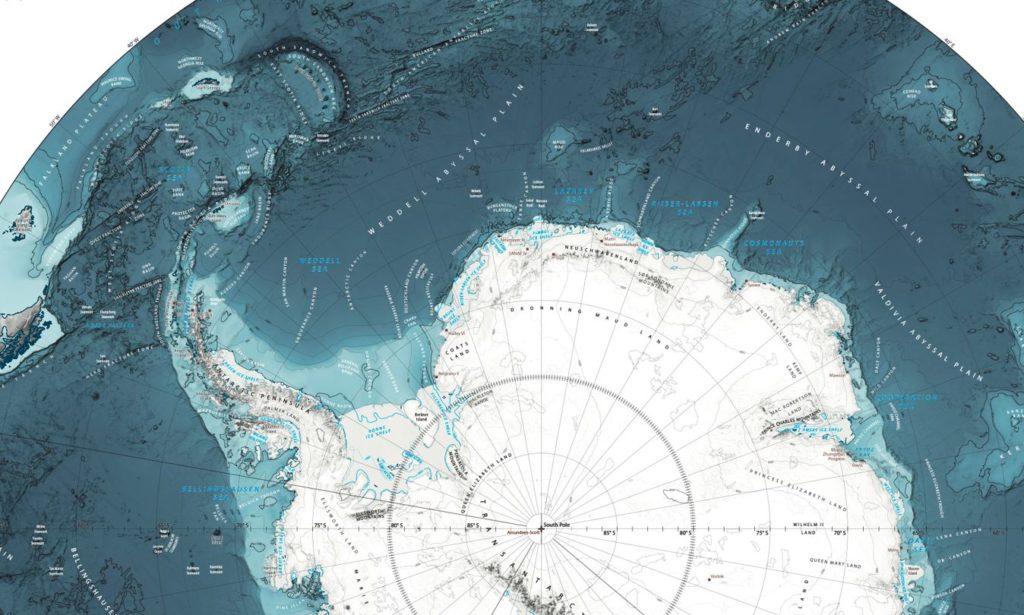
Only ship-based methods can currently collect high-resolution data. As a result, multibeam echosounder readings recorded in the Southern Ocean by research boats such as the icebreaker Polarstern frequently reveal previously unknown topographical features such as the Madiba Seamount, a 1,920-meter seamount named after Nelson Mandela’s nickname.
“No matter where you travel or work, you need a map for orientation.” Dr. Boris Dorschel-Herr, Head of Bathymetry at the Alfred Wegener Institute, Helmholtz Centre for Polar and Marine Research, explains “that’s why virtually all oceanographic disciplines rely on detailed maps of the ocean floor.”
“For example, the seafloor topography of the Southern Ocean is essential to understanding a range of climate-relevant processes. Warm water masses flow into deep troughs in the continental shelf towards the ice shelves and glaciers of the Antarctic, affecting how they melt. Conversely, the stability and calving behaviour of glaciers and ice sheets greatly depend on the features of the ground beneath them. With the IBCSO v2, we have delivered the best and most detailed representation of the Southern Ocean to date.”
The International Bathymetric Chart of the Southern Ocean (IBCSO) is an international initiative tasked with charting the Southern Ocean and coordinated by the AWI. In 2013, the IBCSO issued the first digital bathymetric model (IBCSO v1) and a high-resolution map of the area south of 60°S. Since then, the volume of new measurement data has increased dramatically.
IBCSO has been a part of the Nippon Foundation – GEBCO Seabed 2030 Project since 2017, which has set the lofty aim of mapping all of the world’s oceans by 2030.
“The new version of IBCSO – IBCSO v2 – for the Southern Ocean now covers the entire area south of the 50th parallel – which means 2.4 times as much seafloor as the first version – at a high resolution of 500 by 500 metres,” says Dorschel-Herr.
“As a result, the Antarctic Circumpolar Current and the key oceanographic ‘gateways’ essential to understanding it – the Drake Passage and the Tasmanian Passage – are included in their entirety. The chart is based on more than 25.5 billion measurements supplied by 88 institutions in 22 countries.”
Image Credit: The Alfred Wegener Institute
You were reading: A New Map Shows Seafloor Of The Southern Ocean As Never Seen Before